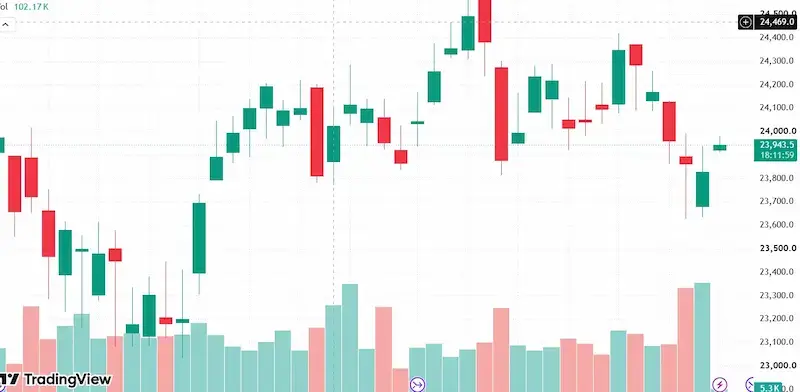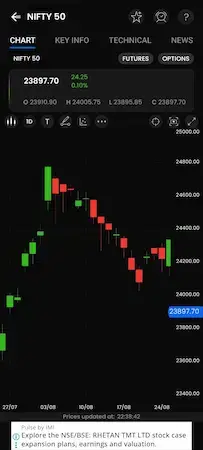
You are not alone if you have ever looked over a stock chart and was thinking what those red and green candles are really telling you. Although candlestick charts might at first seem complex, each candle is simply a simplified summary of the price movement over a given time frame.
Learning how to read single candlestick pattern a glass ball is not the same as a candlestick. A single candle does not indicate whether the price will increase or decrease. Rather, it offers a piece of information that, when paired with trend, support and resistance, volume, and confirmation from later price movement, becomes much more valuable. For this reason, knowing the meaning behind each candle is more important for successful candlestick reading than learning dozens of unique names.
READ MORE: https://marketmantra2026.in/common-investing-mistakes-beginners-make/
What Is a Single Candlestick Pattern?
A single candlestick pattern is a formation created by one candle on a price chart.
That candle represents four basic prices:
- Open – where the period began
- High – the highest price reached
- Low – the lowest price reached
- Close – where the period ended
The real body is the thick part. Wicks or shadows are the simplify lines that extend above and below it. The gap between the opening and closing prices is displayed in the body. The price’s distance from those levels before it returned is shown by the wicks. Imagine a stock that starts at ₹100, increases to ₹108, declines to ₹96, and ends at ₹106. There is much more to the candle than just “the stock went up.” It informs you that:
- Price increases were forced by buyers.
- Throughout the day, sellers were able to drive it below the opening price.
- Eventually, buyers took back control.
- The closing price of the session was higher than the starting price.
That is the basic idea behind how to read single candlestick pattern formations.
Candlestick Anatomy
Everything that follows is based on the body of a candle.
1. Real Body
During that time, a huge body typically indicates a stronger directional movement. The opening and closing prices were comparatively close when the body was small.
2. Upper Wick
The upper wick shows how high price travelled before retreating.
A long upper wick can indicate that higher prices were rejected.
3. Lower Wick
The bottom wick shows how low the price went before rising. Rejecting lower pricing may be indicated by a long lower wick.
4. Candle Range
The candle’s range is the whole distance from high to low. More price movement is represented by a candle with a wide range than by one with a narrow range. The various single-candle formations that traders examine are made by an exchange of body size, wick size, and position.
Why Context Matters More Than the Candle Name
Treating each candle as a separate trading signal is one of the most common mistakes made by beginners. Let us say you come across a candle with a lengthy lower wick and a small body. You might refer to it as a hammer right away. However, that is not enough. Depending on where it appears, the same basic shape might mean multiple things. A hammer can show that sellers pushed the price down before purchasers recovered it, and it usually shows up after a decrease. A Hanging Man, which can be a bearish warning, is a very similar shape that appears after a significant gain.
This is why how to read single candlestick pattern formations need examining the surrounding chart.
Use the following queries:
Was the price previously increasing or decreasing?
Is the candle close to a support? Does it resemble resistance?
Has the market already changed significantly?
Is the volume abnormally high or low? Does the motion get confirmed by the next candle?
You get a hint from the candle. The context is provided by the local market. Similar to this, Zerodha Varsity’s research-based instructional materials stress being adaptable and searching for the previous trend rather than viewing candlestick definitions as strict guidelines.
The Most Important Single Candlestick Patterns
You don’t have to commit every possible candlestick shape to memory.
It is more beneficial for novices to have a thorough understanding of a small group.
Among the most remarkable formations are:
| Pattern | General Message | Typical Context |
|---|---|---|
| Hammer | Possible bullish reversal | After a decline |
| Hanging Man | Possible bearish warning | After an advance |
| Shooting Star | Possible bearish reversal | After an advance |
| Inverted Hammer | Possible bullish reversal | After a decline |
| Doji | Indecision | After a move or near key levels |
| Spinning Top | Indecision | During uncertain conditions |
| Bullish Marubozu | Strong buying pressure | Strong directional move |
| Bearish Marubozu | Strong selling pressure | Strong directional move |
There are no guaranties in these readings. Confirmation and market environment have a major role in their utility.
1. Hammer Candlestick
One of the most well-known single-candle formations is the Hammer.
Typically, it has:
A relatively tiny body
An extended lower wick
A tiny or insignificant upper wick
An earlier fall
The lower shadow is the key element.
Let’s say a stock has dropped over numerous sessions from ₹150 to ₹120.
In a single session, it starts at about ₹120, falls to ₹112, and then buyer pressure pushes it back toward ₹119.
The last candle illustrates how purchasers strongly opposed sellers’ initial attempts to seize control.
That does not automatically mean the stock will reverse.
However, if the Hammer forms near an important support zone and the next candle confirms buying strength, the setup becomes more interesting.
Zerodha’s technical-analysis material describes the Hammer as a long-lower-shadow formation appearing at the bottom of a downtrend and emphasizes the importance of its surrounding trend.
Example: Hammer at Support
Consider this simplified order:
₹150 → ₹142 → ₹135 → ₹128 → Hammer → ₹133 → ₹140
The Hammer’s look following a drop and following upward rise gives it greater meaning.
The lesson is straightforward:
Just because you see a hammer doesn’t mean you should buy. Examine what follows.
2. Hanging Man
The Hanging Man looks like a hammer quite a bit.
Its placement makes a difference.
After an advance, a Hanging Man emerges.
For example:
₹100 → ₹108 → ₹115 → ₹122 → Hanging Man
Before the market recovered, sellers were able to drive prices far lower during the Hanging Man session.
This does not imply that the rise has ended.
Rather, it indicates that selling pressure emerged within a market where buyers had previously prevailed.
The warning grows more serious if the next candle closes lower and other technical indications concur.
This is a great example of why candle form is insufficient on its own.
3. Shooting Star
In simple terms, a Shooting Star is a rejection of increased costs.
Usually, it comprises:
A little body close to the candle’s base
An extended upper wick
Minimal or nonexistent lower wick
An advance prior to the establishment
Let’s say a stock rises from ₹200 to ₹260.
Excitement is created when purchasers push it to ₹275 one day.
However, vendors appear out of nowhere.
The stock declines and closes at about ₹255.
The extended upper wick that results tells you something crucial:
Although tested, higher pricing were not effectively maintained.d.
If this happens near resistance after an extended rally, traders may pay closer attention.
Zerodha’s candlestick material identifies the Shooting Star as a single-candle formation appearing near the top of an uptrend and discusses the high of the candle as a risk reference for a bearish setup.
4. Inverted Hammer
The Shooting Star and the Inverted Hammer have a similar form.
Where it happens makes a difference.
After a normal fall, an inverted hammer emerges.
It indicates that during the session, buyers tried to raise the price.
Although the attempt may not have been effective enough to cause an instant reversal, it may be a sign that purchasers are starting to resist the current selling pressure.
Confirmation becomes more crucial because of this.
5. Doji Candlestick
One of the easiest formations to identify is the Doji.
Because the starting and closing prices are so similar, the body is likely very small or none.
In essence, a Doji indicates that neither team was able to end the session with a clear advantage.
However, what it means is altered by circumstance.
In a calm sideways market, a Doji might not imply anything.
Following a strong multi-session rise, a Doji may get greater attention since it implies that momentum may be waning.
In a similar vein, a Doji following a protracted downturn may suggest seller uncertainty.
Crucially, reversal is not always implied by a Doji.
Doji candles express hesitation, according to Zerodha, and their interpretation becomes more helpful when taken into consideration in light of the larger trend.
Simple Doji Example
Imagine:
₹100 → ₹108 → ₹115 → ₹120 → Doji
The Doji indicates buyers and sellers ended the most recent session about evenly, given the recent rising trend.
The following candle becomes important.
The Doji can just indicate a halt if the subsequent candle breaks sharply higher.
The Doji may have indicated an early loss of momentum if the subsequent candle breaks downward.
6. Spinning Top
A Spinning Top has:
- A small real body
- An upper wick
- A lower wick
- Often relatively balanced shadows
It represents uncertainty.
During the session, buyers pushed price higher and sellers pushed it lower, but neither side managed to create a decisive closing move.
Think of it as a tug-of-war in which neither team wins clearly.
A Spinning Top can appear before either continuation or reversal, so traders should avoid assuming its direction.
Marketmatra2026 specifically describes Spinning Tops as showing indecision and notes that their interpretation changes depending on whether they appear during an uptrend or downtrend.
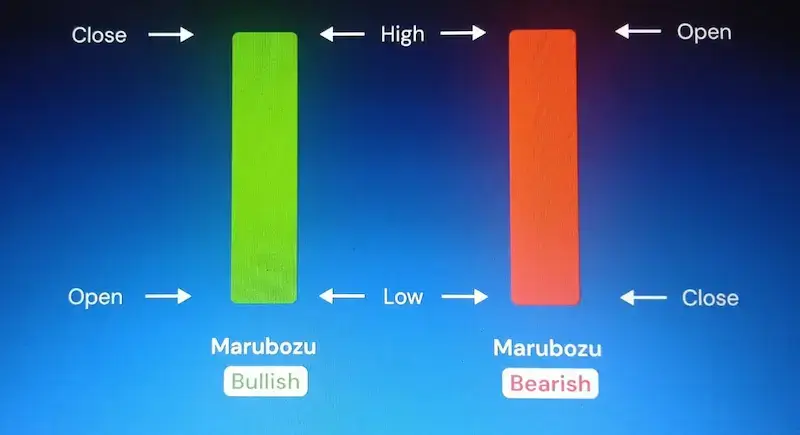
7. Marubozu
The Marubozu is almost the opposite of a Doji.
Instead of a tiny body, it has a large body and little or no wick.
A bullish Marubozu suggests strong buying pressure.
A bearish Marubozu suggests strong selling pressure.
For example:
₹100 open → ₹118 close
with almost no meaningful upper or lower wick indicates that buyers dominated the session.
A bearish example would look like:
₹120 open → ₹102 close
with little or no wick.
The important point is momentum.
Zerodha’s educational material describes bullish and bearish Marubozu candles as strong directional candles and also warns that unusually short or abnormally long candles should be interpreted carefully rather than mechanically.
How to Read a Single Candle Step by Step
Instead of memorizing patterns randomly, use a repeatable process.
Step 1: Identify the Trend
First ask:
What has price been doing before this candle appeared?
Is the market:
- Rising?
- Falling?
- Moving sideways?
- Consolidating?
A candle has much more meaning when you know what happened before it.
Step 2: Study the Body
Look at the distance between open and close.
A large body suggests stronger directional movement.
A small body suggests hesitation or balance.
Do not focus only on whether the candle is green or red.
Body size matters.
Step 3: Study the Upper Wick
Ask:
Did price attempt to move higher but fail to hold those levels?
A long upper wick can indicate rejection of higher prices.
This becomes particularly interesting around resistance.
Step 4: Study the Lower Wick
Ask:
Did price fall sharply and then recover?
A long lower wick can indicate rejection of lower prices.
Around support, this may deserve additional attention.
Step 5: Locate Support and Resistance
A candlestick appearing at an important price level can be more meaningful than an identical candle in the middle of an empty trading range.
For example:
Resistance + Shooting Star + bearish confirmation
is generally more informative than:
Shooting Star in the middle of a random range.
Likewise:
Support + Hammer + bullish confirmation
can provide a more structured setup than simply seeing a Hammer anywhere on the chart.
Step 6: Check Volume
Volume can help answer an important question:
Was there meaningful participation behind this price movement?
A rejection candle accompanied by unusually strong volume may deserve more attention than the same shape appearing on very low activity.
However, volume should not be treated as an automatic confirmation either.
It is another piece of evidence.
Step 7: Wait for Confirmation
This is where many beginners become impatient.
A candle finishes.
The trader immediately enters.
Then price moves in the opposite direction.
Instead, consider waiting for the next candle to provide additional evidence.
For a potential bullish reversal, traders might look for:
- A higher close
- A break above the signal candle
- Increasing volume
- Support holding
For a potential bearish reversal, traders might look for:
- A lower close
- A break below the signal candle
- Selling volume
- Resistance holding
The exact confirmation rule should depend on the strategy and timeframe.
Practical Example: Reading a Hammer Correctly
Imagine a stock has been falling for eight sessions.
The price moves:
₹500 → ₹490 → ₹480 → ₹470 → ₹462 → ₹455
Then a Hammer forms.
During the session:
- Open = ₹456
- High = ₹462
- Low = ₹440
- Close = ₹459
At first glance, the candle looks bullish because it recovered from ₹440.
But should you immediately buy?
Not necessarily.
Now suppose ₹440 is also a major historical support zone.
The setup becomes more interesting.
Then the following session opens at ₹461 and closes at ₹470 on stronger volume.
Now the original Hammer has received confirmation.
This is a much stronger analytical process than simply saying:
“Hammer means buy.”
The candle created a hypothesis.
The following price action helped test that hypothesis.
How Support and Resistance Improve Candlestick Reading
Support and resistance are among the most useful concepts to combine with single-candle analysis.
Support
Support is an area where buying interest has previously helped stop or slow a decline.
A Hammer near support may suggest that buyers are defending the area.
Resistance
Resistance is an area where selling pressure has previously limited an advance.
A Shooting Star near resistance may suggest that buyers struggled to maintain higher prices.
The key word is near.
A pattern does not become powerful merely because someone can find a support or resistance line somewhere on the chart.
The level should be reasonably relevant to the current price structure.
Common Mistakes Beginners Make
Understanding mistakes can be just as valuable as learning patterns.
Mistake 1: Trading Every Pattern
Not every Hammer deserves a trade.
Not every Doji predicts a reversal.
Not every Shooting Star means a stock will crash.
Patterns are clues, not commands.
Mistake 2: Ignoring the Trend
Calling a candle a Hammer without looking at the previous trend can lead to incorrect interpretation.
Context changes meaning.
Mistake 3: Entering Too Early
A trader sees a candle and enters before confirmation.
Sometimes price immediately reverses.
Patience can help reduce this problem.
Mistake 4: Ignoring Risk Management
Even excellent-looking patterns can fail.
A predefined exit level can prevent a small mistake from becoming a large loss.
Mistake 5: Using Extremely Small Timeframes Without Experience
A five-minute candle can produce a pattern that looks impressive but disappears when viewed on a daily chart.
The timeframe should match your trading approach.
Mistake 6: Believing Candlesticks Predict the Future
They do not.
A candlestick records what happened during a particular period.
Its interpretation is based on price behavior and probability, not certainty.
Which Timeframe Is Best for Single Candlestick Patterns?
There is no universal best timeframe.
A day trader may study:
- 1-minute
- 5-minute
- 15-minute
- 30-minute charts
A swing trader may focus more heavily on:
- 1-hour
- 4-hour
- Daily charts
A long-term investor may pay more attention to:
- Weekly
- Monthly charts
The important thing is consistency.
If you are a beginner, daily charts can be easier to study because there is generally less short-term noise than on extremely small intraday timeframes.
A Simple Beginner Trading Checklist
Before acting on any single candle, ask:
Trend
What was price doing before the candle?
Structure
Is the body large or small?
Wick
Which side has the longer wick?
Location
Is the candle near support or resistance?
Volume
Is there meaningful trading activity?
Confirmation
Did the next candle support the interpretation?
Risk
Where would the trade idea be considered invalid?
Reward
Is the potential reward worth the risk?
If several answers are unclear, there may be no reason to force a trade.
Sometimes the best trading decision is simply waiting.
How to Practice Reading Single Candles
You do not need to risk money to improve.
Open a historical chart and hide the candles after a particular date.
Then move forward one candle at a time.
For every candle, write down:
- What is the current trend?
- What does the body tell me?
- What does the upper wick tell me?
- What does the lower wick tell me?
- Is there support or resistance nearby?
- What happened on the following candle?
- Was my original interpretation correct?
After doing this with dozens or hundreds of examples, you will begin to notice something important.
You stop seeing candles as isolated shapes.
You start seeing them as evidence of changing buying and selling pressure.
That shift is the real objective of how to read single candlestick pattern analysis.
Are Single Candlestick Patterns Reliable?
They can be useful, but they are not perfect.
A candle is only one observation from a much larger market.
Price can reverse because of:
- Earnings announcements
- Economic data
- Interest-rate decisions
- Company-specific news
- Market sentiment
- Unexpected events
- Changes in liquidity
- Broader index movements
This is why experienced traders generally avoid relying on a single technical signal in isolation.
The goal is not to find a pattern that predicts every move.
The goal is to find situations where multiple pieces of evidence point in the same direction while keeping potential losses controlled.
The Psychology Behind Candlestick Patterns
Candlesticks become easier to understand when you stop thinking about them as shapes.
Think about the people behind the price.
A Hammer tells a story:
Sellers pushed price down.
Buyers appeared.
Price recovered.
A Shooting Star tells another story:
Buyers pushed price higher.
Sellers appeared.
Price fell back.
A Doji tells a quieter story:
Both sides fought for control.
Neither finished decisively ahead.
A Marubozu tells a much louder story:
One side dominated the session.
This psychological interpretation makes candlestick analysis much easier to remember.
Instead of memorizing dozens of definitions, you are learning to recognize changes in market behavior.
Final Thoughts
Learning how to read single candlestick pattern formations is one of the simplest ways for a beginner to start understanding price action.
But the real skill is not memorizing whether a candle is called a Hammer, Doji, Shooting Star or Marubozu.
The real skill is learning to ask better questions.
Where did the candle appear?
What happened before it?
Who appeared to gain control?
Was price rejected from an important level?
Was volume supportive?
Did the next candle confirm the idea?
And, most importantly, where would the trade idea be considered wrong?
Once you start thinking this way, candlestick charts become much less mysterious.
A single candle is only one piece of information. Combine it with trend analysis, support and resistance, volume, confirmation and sensible risk management, and you can develop a much more disciplined approach to reading charts.
The objective of how to read single candlestick pattern analysis should never be to predict every market movement.
It should be to understand price behavior better, identify potentially useful setups, and make decisions based on evidence rather than emotion.
Remember: a candle is a clue, not a guarantee.