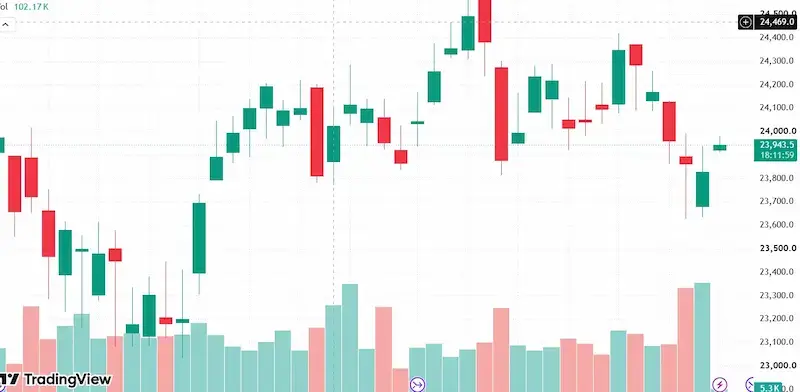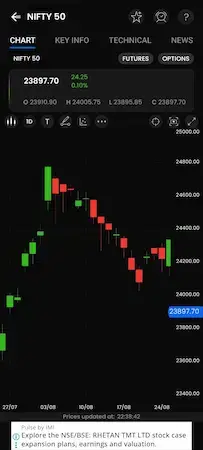
Candlestick charts can at first seem complex. It may appear that only seasoned traders can comprehend a screen full of red and green candles, long wicks, short bodies, support levels, and resistance zones.
However, if you interpret candles as a series instead of as individual candles, candlestick analysis becomes much easier.
The three candlestick rule is one idea that traders are often called upon. While the statement indicates that there should to be a single, set formula, this is not entirely true. The phrase is used by several trade schools to refer to various three-candle strategies, which often involve momentum, exhaustion, confirmation, or a possible reversal. While accepted forms like Three Inside Up, Three Inside Down, Morning Star, and Evening Star have specific definitions, some resources use it more broadly for a three-candle reversal concept.
This distinction is important since making bad judgments might result from taking any three candles as a trading indication.
This article will explain the concept in plain English, demonstrate how traders understand the three-candle sequence, talk about bullish and bearish scenarios, examine real-world instances, and explain why market context and confirmation are more significant than just counting candles.
READ MORE: https://marketmantra2026.in/what-are-the-top-5-index-funds-in-india/ https://x.com/deepakdgy/status/2096913342225141833?s=20
What Is the 3 Candlestick Rule?
What is the three candlestick rule’s fundamental idea? is that instead of depending just on one candle to forecast the upcoming market move, traders examine three successive candles collectively.
Whether momentum is continuing, waning, or starting to change is something that a three-candle sequence can show that a single candle cannot.
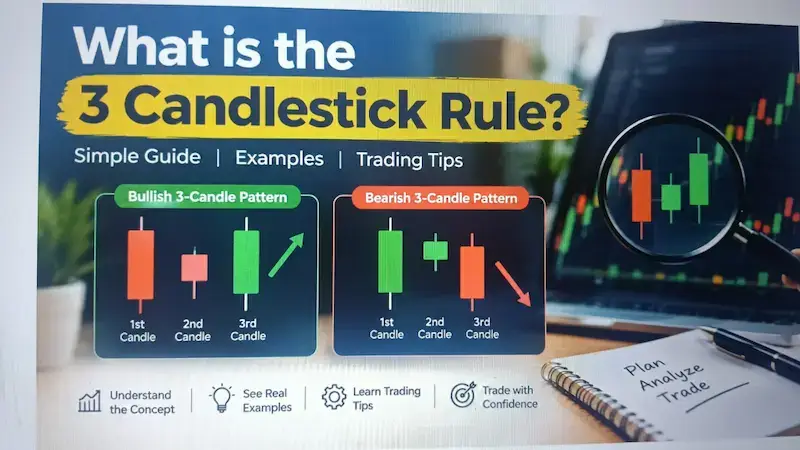
Consider a stock that has been sharply declining. Aggressive selling is demonstrated by the first candle. The fact that the second candle is much smaller indicates that the downward momentum could be waning. After then, the third candle rises and closes firmly.
Together, the three candles provide a more comprehensive narrative:
Strong selling → slowing momentum → potential buyer control
That does not automatically mean the stock will rise. Instead, it tells the trader that the balance between buyers and sellers may be changing.
This is why three-candle analysis is better viewed as a framework for reading price action rather than a guaranteed buy-or-sell rule.
Why Three Candles Can Be More Informative
Information regarding a single trading period may be found in a single candlestick. Its upper and lower shadows depict the price extremes of the session, while its body displays the link between opening and closing prices.
A second candle provides the trader with a benchmark.
Further proof may be obtained from the third candle.
This development aids traders in crafting more insightful queries:
Is momentum intensifying?
Is the current trend waning?
Do buyers or sellers take charge?
Did the price cross a significant threshold?
Was the prior warning confirmed by the third candle?
Does the pattern show up at significant resistance or support?
This concept of successive information is the foundation of well-known three-candle patterns. A bearish candle, a smaller candle inside it, and a bullish confirmation candle are all combined in the Three Inside Up pattern, for instance. The reasoning is reversed by the Three Inside Down pattern.
How the Three-Candle Idea Works
What is the three candlestick rule? What is the easiest method to grasp it? is to consider three phases of market behavior.
Candle 1: Existing Momentum
The current trend is often represented by the first candle.
Sellers may have been driving down prices in a bearish situation.
Buyers may have been driving up prices in a bullish scenario.
The beginning is established by the first candle.
Candle 2: Momentum Changes
Things start to become interesting at the second candle.
It could be smaller than the first candle, grow a long wick, go in the other direction, or stay within the range of the preceding candle.
This may be a sign of reluctance.
Crucially, hesitation and reversal are not the same thing.
It is possible for a market to halt and then move in the same direction.
Candle 3: Confirmation
The most important data is given by the third candle.
Traders could view the sequence as proof that control is changing if it closes above a high price level and travels sharply in the other direction.
Numerous well-known three-candle formations illustrate this idea. For example, the defining confirmation of a Three Inside Up pattern occurs when the third bullish candle closes above the high of the first bearish candle.
Bullish Interpretation of the Three-Candle Rule
What is the three candlestick rule used by traders? They often look for signs that buyers are growing more demanding and sellers are losing control in preparation of a possible positive outcome.
This is how a simpler sequence may appear:
Large bearish candle → smaller/uncertain candle → strong bullish candle
Suppose a stock falls from ₹500 to ₹470 over several sessions.
A large bearish candle pushes it toward ₹465. The next candle has a relatively small body and fails to reduce the amount of major advancement. After that, a powerful bullish candle forms and closes above an important level of short-term resistance.
“Three candles appeared, so I should buy” is not the trader’s only thought.
In fact, the trader queries:
Before then, was there a real downward trend?
Did the enthusiasm for selling wane?
Did purchasers create a third candle that was convincing?
Was a significant resistance level broken by the price?
Bearish Interpretation
It is possible to use the same idea in reverse.
A possible bearish sequence could look like this:
Strong bullish candle → smaller or indecisive candle → strong bearish candle
Let’s say an index has increased consistently over a number of sessions.
The index is pushed into a prior resistance zone by a big bullish candle. The next candle shrinks, indicating that buyers are no longer pushing the price as much. After that, a third candle drops sharply and closes below a crucial support level.
The sequence can indicate that sellers are taking over and purchasing momentum has diminished.
Once more, a fall isn’t certain by the pattern alone.
It only provides the trader with a reason to thoroughly examine the situation.
A similar bearish-reversal structure is used in the well-known Three Inside Down pattern, which consists of a bullish candle, a tiny bearish candle inside the preceding body, and a third bearish candle that validates the move.
Three Candlestick Rule vs Three Inside Up
It is not acceptable to use these words interchangeably.
Sequential price movement can be understood using the more general three-candle approach. There are precise conditions required for the production of the Three Inside Up candlestick pattern.
In general, a Three Inside Up needs:
An earlier downward trend
A big bearish first candle
A second candle that is smaller and has its body inside the original candle’s
An optimistic third candle
The third candle is closing over the peak of the first candle.
In essence, the pattern consists of a bullish harami followed by a bullish candle that confirms it.
Because of this, the Three Inside Up is far more accurate than merely stating that a reversal is indicated by three candles.
Three Candlestick Rule vs Three Inside Down
The bearish counterpart is Three Inside Down.
The general structure of it is:
An ongoing upward trend
An enormous bullish first candle
A second, smaller candle within the first
A third candle that is negative
Verification that sellers are assuming responsibility
The key takeaway is that sequencing and placement are crucial.
In the middle of a sideways market, three identical candles that occur at random do not carry the same meaning as a structured three-candle reversal occurring after an extended trend.
What About Three Long Candles?
It’s important to understand a different viewpoint.
A “three candle rule” is defined by certain instructional materials as a scenario in which three long-bodied candles occur in the same direction following a long move, which could suggest that the move is being stretched and may even reverse.
For example:
Long bullish candle → long bullish candle → long bullish candle
After a lengthy rise, a trader may become wary since a series of strong increases may signal aggressive momentum that might eventually become overextended.
However, this shouldn’t be understood as:
Three green candles = sell.
Markets can continue in the same trend while creating three, five, or even more powerful candles.
Momentum can last far longer than a trader thinks.
For this reason, background is important.
A Practical Example
Imagine a stock that is trading for ₹1,000.
For a few weeks now, the stock has been falling.
On the first day:
Available: ₹970
Elevated: ₹975
Low: ₹930
Close: ₹940
This session is really bearish.
Day 2:
₹942 is open.
Elevated: ₹955
Low: ₹935
Close: ₹950
It’s a considerably smaller candle. Although they are still there, sellers are no longer using as much pressure to cut prices.
Day 3:
Available: ₹952
Elevated: ₹990
Low: ₹948
Close: ₹985
Buyers have now created a powerful bullish candle.
According to the order, buyers got stronger and selling pressure decreased.
However, the chart around the setup would still be examined by a skilled trader.
The seeming turnaround could not succeed if ₹990 is important resistance and the price drops below it right after.
The situation becomes more intriguing if the price breaches ₹990 with significant participation and stays above that level.
It is more than just the presence of three candles; it is confirmation and context.
Why Volume Matters
Candlestick patterns display price behavior, but volume could provide more details about activity.
Let’s say a bullish third candle is followed by volume that is considerably higher than it was in the previous sessions.
Given that the price shift had place at a period of increased market activity, this might strengthen the case for the move.
Volume, however, should also not be regarded as a stand-alone assurance.
A trader might mix:
Candlestick structure + volume + support/resistance + broader trend
instead than depending just on one signal.
This method is in line with the more general idea that candlestick forms shouldn’t be seen as automated forecasts but rather should be read within the environment of the market.
The Importance of Support and Resistance
Focusing just on the form of the candle is one of the most common mistakes made by novices.
Location may be equally important.
An similar pattern that appears at random in the middle of a trading range may not merit as much attention as a bullish three-candle setup that forms precisely above a well-established support zone.
Similarly, a bearish setup close to a major resistance region could have greater meaning than the same pattern emerging following a little intraday advance.
Candlestick patterns should be viewed as proof rather than guidelines.
The framework for interpreting such evidence is provided by the chart’s greater structure.
Which Timeframe Is Best?
The three-candle method is not necessarily dependable due to a lack of a standard timescale.
Traders may examine:
- 5-minute charts
- 15-minute charts
- 1-hour charts
- 4-hour charts
- Daily charts
- Weekly charts
While shorter timeframes result in more signals, they may also include more noise from the market.
Because each candle on a daily chart reflects a whole trading session, it usually offers a deeper view of price behavior.
Studying three-candle patterns on daily charts might be simpler for novices than diving right into extremely small timeframes.
Finding the timeframe with the greatest indications is not the objective. The goal is to identify a period of time when the pricing structure is sufficiently transparent for regular analysis.
Common Mistakes Beginners Make
1. Treating Every Three Candles as a Signal
A good trade setup is not always created by three candles alone.
Certain formation conditions apply to particular candlestick patterns.
2. Ignoring the Existing Trend
Something must be reversed for there to be a reversal.
The same candles emerging in a sideways market should be viewed differently than a bullish reversal pattern in a strong downturn.
3. Entering Before Confirmation
It may be early to enter a trade as soon as you see the first two candles.
The validation that separates a growing setup from a finished pattern is usually given by the third candle.
4. Ignoring Support and Resistance
Even if the candles seem bullish, a pattern that shows up just beneath major resistance may have limited upside.
5. Assuming a Pattern Guarantees Profit
A winning trade cannot be backed up by any candlestick pattern.
Probabilities, not certainties, are the focus of technical analysis.
6. Forgetting Risk Management
Even a well-thought-out arrangement might go wrong.
Instead of choosing where to quit after the trade swings against them, a trader should be aware of the invalidation level before joining.
How to Use the Three-Candle Approach More Effectively
A straightforward checklist may greatly improve the discipline of analysis.
Step 1: Identify the Trend
Find out if the market is moving sideways, downward, or upward.
Step 2: Locate the Three Candles
Examine the candles in order rather than one at a time.
Step 3: Compare Candle Sizes
Keep an eye out for changes in momentum.
Although it is not always a reversal, a huge candle followed by a smaller candle may show a decrease in immediate momentum.
Step 4: Examine the Third Candle
Find out whether the expected shift is confirmed by the third candle.
Step 5: Check Key Price Levels
Search for moving averages, breakout levels, swing highs, swing lows, support, and resistance.
Step 6: Check Volume
Check if the price movement is supported by participation.
Step 7: Define Risk
Identify where the setup would be rejected before evaluating an entry.
This procedure avoids the typical error of making an emotional transaction based on a visual pattern.
Is the Three Candlestick Rule Reliable?
What you mean by the phrase will decide the response.
There isn’t a single accuracy % that works for all three-candle setups. Results vary depending on patterns, marketplaces, time periods, entrance and departure policies, and market circumstances.
For instance, while the more general “three candle rule” can be interpreted much more loosely, well-known patterns like Three Inside Up and Three Inside Down have precise structures.
Therefore, statements like “this pattern works 90% of the time” should be viewed with suspicion unless they are backed up with a precise historical test.
A serious trader should be more concerned with determining whether a strategy has positive expectation after taking in
- Winning trades
- Losing trades
- Average profit
- Average loss
- Transaction costs
- Slippage
- Market conditions
- Position sizing
Three-Candle Patterns Worth Learning
After you grasp the fundamentals, it is useful to examine a few well-known forms.
Morning Star
A downturn is typically linked to a positive reversal formation.
Three candles are used in the pattern, which highlights the change from bearish pressure to bullish confirmation.
Evening Star
The Morning Star’s negative counterpart.
It may indicate that an upswing is about to give way to a downturn.
Three Inside Up
A bullish Harami and a confirming bullish candle form the basis of this bullish reversal pattern.
Three Inside Down
A bearish Harami structure is used in this bearish reversal pattern, which is followed by bearish confirmation.
Three White Soldiers
When the larger context supports it, three successive strong bullish candles after a loss are sometimes regarded as a possible bullish reversal.
Three Black Crows
Three strong bearish candles after an advance represent the bearish counterpart.
It is usually more beneficial to learn these particular forms rather than commit an oversimplified three-candle “rule” to memory.
A Simple Trading Framework for Beginners
Instead of asking only, “What is the 3 candlestick rule?”, ask five broader questions:
Prior to the pattern, what was the market doing?
Did momentum shift during the course of the three candles?
Was there confirmation from the third candle?
Is the setup taking place at a high price point?
Where has the trading notion been shown to be incorrect?
Candlestick analysis is transformed from pattern recognition to organized decision-making by these issues.
That distinction is crucial.
You should be able to develop a hypothesis with the use of a chart pattern. It shouldn’t take the place of more comprehensive market analysis or risk management.
Frequently Asked Questions
What is the 3 candlestick rule?
What is the 3 candlestick rule? It often refers to studying a series of three successive candlesticks in order to spot shifts in momentum, possible reversals, or continuance. Still, there isn’t a single, accepted candlestick pattern related to the word. It is used differently by various learners.
Is the three-candle rule bullish or bearish?
This might be the case. The three candles’ actions and the direction of the previous trend decide the meaning. Technical analysis makes a great deal of both bullish and bearish three-candle setups.
Is three candlestick confirmation better than one candle?
Because it displays price behavior across several time periods, a three-candle series can offer additional information. More candles do not, however, always indicate a more precise forecast. Risk management, context, and validation are still important.
Can beginners use three-candle patterns?
Indeed. When combined with fundamental ideas like trend, support, resistance, and volume, they can be helpful in understanding price behavior.
Should you buy after three bullish candles?
Not by default. Three bullish candles might appear close to the end of a long rise, but they can also indicate strong momentum. Before making a choice, traders should consider volume, risk, resistance levels, and the overall trend.
What is the difference between a three-candle rule and Three Inside Up?
The phrase “three-candle rule” refers to a variety of methods for reading three successive candles. A chosen bullish reversal pattern with particular formation requirements is called Three Inside Up.
Final Thoughts
Knowing what the three candlestick rules are. is more about understanding how pricing behavior changes from one session to the next than it is about keeping track of three candles by heart.
The current momentum may be seen in the first candle. The second may indicate delay or a possible slowdown. The third might show that buyers or sellers are starting to take charge.
However, one should never consider a candle sequence in a vacuum.
Candlestick structure, trend direction, support and resistance, volume, market circumstances, and well-defined risk are all included in the best analysis.
Above all, keep in mind that candlestick patterns depict price movements. They have no idea what will come next.
For this reason, identifying a pattern that accurately forecasts the future is not the goal of good technical analysis. It involves quantifying the risk, recognizing instances when the evidence is favorable, and acknowledging that even well-designed settings can go wrong.
Start with learning a few well-known three-candle patterns, such as Morning Star, Evening Star, Three Inside Up, Three Inside Down, Three White Soldiers, and Three Black Crows, if you’re new to technical analysis. Then, before thinking about real-money transactions, try spotting them on historical charts.
Understanding the narrative that candles provide regarding buyers, sellers, momentum, and market structure is more beneficial than simply observing three candles.