The stock market frequently gives the impression of being unpredictable. Prices can fluctuate in ways that seem illogical, climb suddenly, and fall suddenly. However, millions of traders throughout the world rely on technical analysis because they think it may help them better understand these fluctuations.
You’ve definitely seen charts with vibrant lines, candlestick patterns, and indicators with odd names like RSI and MACD if you’ve just recently begun learning about trading or investing. These tools may seem intimidating at first. But their goal is quite simple: they look for trends in market behavior and price changes..
This causes many newcomers to ask: How does technical analysis work in the stock market?
Technical analysis is the process of analyzing past price data, trade volume, and chart patterns in order to make informed predictions regarding future market moves. Rather than focusing on a company’s financial records or earnings reports, technical analysts examine what the market is doing right now.
In today’s digital investing world, technical analysis is more accessible than ever. Trading platforms now provide extensive charting capabilities, allowing anyone with an internet connection to analyze markets like a professional.
READ MORE: https://marketmantra2026.in/what-is-a-demat-account-used-for/
https://x.com/sunilgurjar01/status/2081058143480471701?s=20
What Is Technical Analysis?
Technical analysis is a method used to evaluate securities by examining historical market data. It is Based on three essential assumptions:
- The market discounts everything.
- Prices follow trends.
- History tends to repeat itself.
These concepts have guided trading techniques for decades.
When investor ask, How does technical analysis work in the stock market? The approach begins with recognizing that market prices frequently reflect collective investor psychology. Fear, greed, optimism, and uncertainty are all factors that can impact price changes.
Technical analysts believe that studying these movements will allow them to discover chances with a high probability of success.
The History of Technical Analysis
Charles Dow, co-founder of The Wall Street Journal, is credited with developing modern technical analysis. His work in the late nineteenth century led to the development of Dow Theory.
Over time, analysts created more techniques, such as:
- Candlestick charts.
- Moving averages.
- Momentum indicators.
- Support and resistance levels.
- Volume analysis.
Today, technical analysis is applied to equities, commodities, currency, cryptocurrencies, and exchange-traded funds.
Its widespread adoption illustrates its long-term relevance in the financial markets.
Understanding Price Charts
Price charts are the basis of technical analysis.
The most common chart types are:
- Line charts.
- Bar charts
- Candlestick charts
- Point and figure charts.
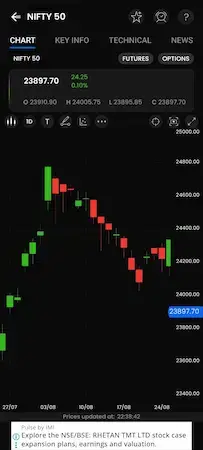
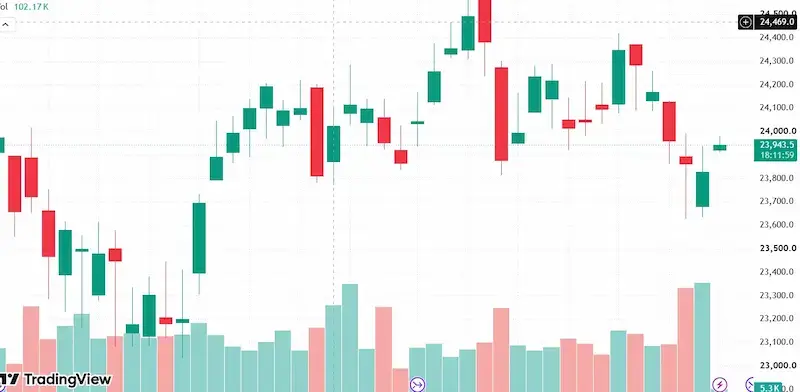
Candlestick charts are still the most popular because they provide extensive information on opening, closing, high, and low prices within a specific period.
To understand How does technical analysis work in the stock market?, It is critical to acquire familiar reading charts.
Traders use charts to identify trends, reversals, and periods of consolidation. Rather of viewing price movements as random, technical analysis seeks to organize them into identifiable patterns.
The Importance of Trends
Trends are one of the most essential ideas in technical analysis.
Markets typically move in three directions:
- Uptrend
- Downtrend
- Sideways trend.
The saying “the trend is your friend” is still one of the most commonly used principles among traders.
For example, buying during a strong rally may provide better odds than attempting to forecast a market reversal.
This is another reason why investors commonly wonder, “How does technical analysis work in the stock market?” Trends offer vital insights into the market.t sentiment and can help traders align their decisions with prevailing momentum.
Support and Resistance Levels
Support and resistance are two of the simplest yet most effective ideas in technical analysis.
- Support is a price level where buying activity is likely to arise.
- Resistance indicates a level at which selling pressure may increase.
These levels typically serve as psychological barriers.
Consider a stock that consistently falls to a specific price before regaining. Traders may start eyeing that level as support. Similarly, if a stock fails to go above a certain price, it may become a resistance level.
Understanding these zones can dramatically improve trade planning.
Popular Technical Indicators
Technical indicators are calculations using price and volume data.
Some of the most widely utilized indicators are:
1. Moving Averages
Moving averages serve to discover trends and level out price volatility.
Examples include:
- Simple Moving Average (SMA
- Exponential Moving Averages (EMA)
2. Relative Strength Index (RSI)
The RSI indicator analyzes momentum and can assist identify possibly overbought or oversold conditions.
3. MACD
The Moving Average Convergence Divergence indicator helps traders in identifying trend strength and momentum.
4. Bollinger Bands
These bands expand and limit themselves in response to market volatility.
If you’re interested, how does technical analysis work in the stock market? Indicators provide a portion of the solution. They turn basic price data into actionable information.
However, experienced traders almost never depend just on one indicator.
The Role of Trading Volume
Volume refers to the number of shares traded in a certain period.
High volume often means:
- Strong investment interest.
- increased market participation.
- Increased conviction in price changes.
For example, a breakout accompanied by a large volume is often thought to be more reliable than one that occurs on low volume.
Volume analysis provides additional context for market action and is frequently used in conjunction with chart patterns and indicators.
Candlestick Patterns Explained
Candlestick patterns have become a vital part of technical analysis.
Popular patterns include:
- Doji
- Hammer
- Engulfing pattern
- Morning Star
- Shooting Star
Each pattern aims to show shifts in market sentiment.
Although no pattern guarantees success, many traders include them into their overall tactics.
As you learn more about how does technical analysis work in the stock market, candlestick analysis becomes more helpful since it provides a visual picture of buyer and seller activity.
Risk Management Matters
TechTechnical analysis is not a crystal ball.
Even the most experienced traders face losses. This is why risk management is critical.
The key risk management approaches include:
- Setting stop-loss orders.
- Position size limitations.
- Diversifying investments.
- Maintaining discipline.
- Following a trading plan.
Professional traders frequently emphasize that conserving capital is as vital as making gains.
A successful trading strategy combines technical analysis with sound risk management techniques.
Advantages of Technical Analysis
Technical analysis provides various benefits:
- Easy access to charting tools.
- This applies to many different asset classes.
- Suitable for short and medium-term trading.
- Helps to discover trends and momentum.
- Supports disciplined decision-making.
Many investors like its flexibility and availability.
As a result, the question is: How does technical analysis work in the stock market? continues to be popular among beginners all across the world.
Limitations of Technical Analysis
Regardless of its popularity, technical analysis has limitations.
This includes:
- False signals.
- Subjective interpretations.
- Markets change rapidly.
- Over-reliance on indicators.
- Emotion-based decision-making.
- There are no perfect analytical methods.
Technical analysis should be seen as a tool for increasing probabilities rather than guaranteeing outcomes.
This balanced viewpoint enables investors to maintain reasonable expectations.
Technical Analysis vs. Fundamental Analysis
Technical and fundamental analysis serve different roles.
| Technical Analysis | Fundamental Analysis |
|---|---|
| Focuses on price | Focuses on company value |
| Uses charts | Uses financial statements |
| Short- to medium-term | Long-term perspective |
| Studies market behavior | Studies business performance |
Many skilled investors combine both tactics.
Understanding the strengths of each strategy helps provide a more complete picture of the financial markets.
The Future of Technical Analysis
AdvAdvances in artificial intelligence, machine learning, and algorithmic trading are transforming technical analysis.
Modern platforms now provide:
- Automated alerts.
- Pattern recognition tools.
- Real-time analytics.
- AI-driven insights.
- Advanced backtesting.
Despite these advancements, the fundamental fundamentals remain largely unchanged: investigate pricing behavior, detect trends, and efficiently manage risk.
This ongoing progress ensures that technical analysis will be an important part of investing and trading for many years to come.
Conclusion
How does technical analysis work in stock market? It should be more clearer.
Technical analysis uses previous price movements, volume, chart patterns, and indicators to discover trends and improve decision-making. It is not about predicting the future with certainty, but rather about understanding probability and market behavior.
Finally, how does technical analysis work in the stock market? It works by assisting traders in making more educated judgments in an environment influenced by human psychology, supply and demand, and shifting market sentiments.
Whether you are a beginner looking at your first chart or an experienced investor working on your plan, technical analysis is still one of the most widely used techniques in modern financial markets.
FAQs
Is technical analysis suitable for beginners?
Yes. Beginners might begin with fundamental concepts such as trends, support, resistance, and moving averages.
Does technical analysis accurately predict stock prices?
No, it improves probabilities but does not guarantee future results.
What is the greatest indication for beginners?
Moving averages and RSI are frequently considered beginner-friendly.
Is technical analysis better to fundamental analysis?
Neither is universally superior. Many investors use both strategies.
Can technical analysis be applied to long-term investing?
Yes, however it is most frequently linked with short- and medium-term trading.